
![]()
![]()
![]()
![]()
![]()
![]()
![]()
![]()
For
much of Davenport’s history, farming has made or unmade the community.
The town and its several villages grew as land was cleared, as agricultural
markets expanded and as farms prospered. Population fell and both
farming and non-farming life declined with the disappearance of those same
markets and farms. In 1820, shortly after the birth of the town,
Davenport’s population was perhaps 1236 persons, about three times what it
had been in 1800.[2]
Population continued to grow until it reached a peak of about 2300 before the
Civil War. After this peak it declined continuously until the start of
the Great Depression.
Until
World War II, agriculture provided almost the entire economic support for the
community. (Lumbering, wood products and other non-agricultural
manufactures of the previous chapter were a distant second.) The trend
in population roughly followed that for Davenport farms. We have to
guess a bit at the exact number of the town’s farms before the State
censuses of 1865 and 1875, but in the latter year there were 333 farms, or one
for every 6.6 residents. This was about the largest number ever of
Davenport farms. From then onwards, both farm numbers and population
fell almost continuously, although both population and farming recovered
slightly during the depression of the 1930s. (See Chapter 10.)
World War II marked the end of the close link between Davenport’s residents
and farming. Population recovered, increasing to new heights in the late
1900s, while the number of farms declined from 183 in 1930 to 133 in 1950 and
to under 15 in 2002.[3]

Three things impress those who read about farming in Davenport’s early days. The first, in contrast to more recent times, is the wide variety found of both crops and farm animals. Douglas Denatale in a “Two Stones for Every Dirt” chapter mentions “buckwheat, rye, oats, corn and potatoes” as the basis for nineteenth century subsistence farming “in addition to carrots, rutabagas, turnips, and cabbage” from the household garden and sheep on the hillsides.[4] Although many families, even those without farms, owned apple trees, a horse (and often an ox or two on the farms), and at least one cow, it was not until the coming of the railroads that dairying emerged as a principal farming activity.
The
second strong impression is how difficult life was for the early
farmers. It is hard for today’s generation to grasp the simplicity,
crudities, and hardships of early rural life. Many of Davenport’s
older generation can still remember barefoot summers—but not of going
barefoot from March to November (see sidebar).
Nicholas
Sigsbee (1816-1889) reminisced toward the end of his life about his West
Davenport boyhood during the years after the town was founded. He
remembered farmer, son and hired men subsisting on a supper of “cider pop,”
a liquid mix of apple cider and rye flour, with dark rye bread and butter on
the side. Sigsbee told of cold, fireless church services; homemade
flannel clothing, and tea substitutes for most families since real tea was
found only in wealthy households and then on Sunday only.[5]
The third profound theme in the old days—and indeed through all of Davenport’s history—has been the need for adaptability and tenacity to cope with continuous change. Some of this change was year-to-year and can be inferred from the early state agricultural census reports of crops planted in two successive years. Abrupt shifts would result from the vagaries of weather at planting time, the vicissitudes of prices and markets, early experiments with crop rotation, and the random inroads of bugs and pests. Longer-run changes and need for constant adaptability are illustrated by the gradual decline of grain production in the valleys and of sheep on the hillsides. These trends were followed by the long, slow emergence of dairying after 1830[6]. Later came the gradual introduction of mechanization (following upon the replacement of most oxen by horses), additional experiments with crops and livestock, and finally the disappearance of most farming, both from the stony hillsides and largely, too, from the fertile valleys.
The
following sections of this chapter will explore the medium to longer-run
changes in cereals, potatoes, butter and cheese, apples and apple cider, hops,
poultry, as well as the abrupt and dramatic decline in maple sugar.[7]
An accompanying Appendix will present a more detailed snapshot of
Davenport farming at the time of the Civil War, based on one of the earliest
agricultural censuses for the Town, that of 1865.
These several discussions will often be in terms of totals and
averages. These disguise the
sometimes great individual variations among farms within the town and are most
useful for broad comparisons and for judging trends over time.
Some notion of variation among farms of differing sizes can be found in
the section on Davenport’s farms in 1865.
The future of Davenport farming will be touched upon at the chapter’s
end, and a few thoughts more will be added in Chapter 15 and in the Epilogue.
Cereal
production. Wheat
was the grain of choice for the first settlers in much of the United States,
and it was a principal cash crop for the early Delaware County farmers.
But beginning about 1830, according to Ulysses Hedrick in his classic
1933 study of agriculture in New York State, wheat was threatened by the “midge
and Hessian fly.” Within a
decade these “had become so destructive that in all eastern New York wheat
growing became unprofitable, and almost ceased to exist.
Ten or fifteen years later, means had been found to combat these pests
and there was a revival in central and eastern New York.”
[8]
In
Delaware County, wheat output fell from 50,585 bushels (Census of 1845) to
20,295 bushels five years later and to a mere 9,494 bushels by the 1855 census[9].
Davenport mirrored this dramatic decline, producing 2,919 bushels in
1845 and only 720 bushels a decade later.
By 1860, Delaware had regained its 1845 production level (Davenport
data are not available). Production
thereafter fluctuated greatly from decade to decade though modest output
continued through 1974, with small peaks in 1920 and 1950 apparently spurred
by increased demand during the two World Wars.
To
make up for the abrupt decline and subsequent uncertainty of wheat production
Delaware County farmers turned to oats
and buckwheat, both of which reached their largest production per farm in
1860. Oats
had been a favorite of Scottish settlers, and New York State had long been a
major producer of both grains. West
Davenport had its own mill specializing in buckwheat
flour, and its product was reportedly held in high repute for many miles
around. Both grains began a
long decline in the early 1900s (buckwheat more so than oats).
The decline was both in absolute terms and in per farm production.
Buckwheat has been from the first a favored minor grain in New York, and to this day [1933] the state produces much of the crop grown in the whole country. Its uses have always been the same, those of provender for poultry and swine and as a human food for making buckwheat cake, a familiar dish on farmers’ tables for at least two centuries. (Hedrick, 1933, 338.)
Rye,
of young Nicholas Sigsbee’s less-than-fond “cider-pop” recollection, was
another early cash crop, sold for whiskey making and otherwise used mostly for
fodder. Rye production also
briefly expanded during wheat’s troubled times.
Its decline, however, began about the time of the Civil War and
accelerated after the turn of that century.
Barley production, used in
brewing beer, for stock feed, and as a substitute for wheat in bread, did not
respond to wheat’s early decline. It
continued to be produced in minor amounts until it had a small but abrupt
resurgence, quadrupling its previous output, in 1880 and 1890, before once
more falling to its earlier levels. (Barley’s
brief comeback, possibly related to a nearby brewery market, provides one more
intriguing question for future historians.)
Corn
was of course a native American crop and well-suited to Delaware County soil
and conditions. (It was known as
“Indian corn” for much of the 1800s, in part to distinguish it from
British usage in which “corn” included all cereals.)
Hedrick observes that “the yield was usually higher than wheat, and
there was always a fair yield on poor land in the hands of careless farmers.”[10]
In the 1835 census, Davenport’s yields per acre planted were oats, 22.6
bushels; corn, 21.1 bushels; buckwheat, 14.7 bushels; barley, 14.4 bushels;
rye, 13.4 bushels; and wheat, 11.5 bushels/acre.[11]
Corn
output expanded rapidly to fill the gap left by wheat, stimulated after the
Civil War by the slow but steady growth in Delaware County’s dairy industry.
Along with most other field crops, however, corn production for grain
(both in annual totals and in averages per farm) began to decline after 1900.
Milk cows per farm, in contrast, grew steadily to a peak about the time
of the 1975 federal census when farmers reported an average of 30 cows per
farm (45 cows per dairy farm). This
was almost four times greater than the Delaware farm average had been towards
the end of the Civil War.
Corn
grown for silage increased also. It
rose rapidly from 23 tons per average Delaware farm in 1950 to 195 tons in
1982. By subsequent censuses,
however, corn silage declined slightly as the outlays for filling corn silos
were lowered through shifting to plastic-wrapped hay silage or “baleage.[12]”

Potatoes.
These provide another example of abrupt change in the medium-term
followed much later by a longer-term decline.
Davenport’s production of white or Irish potatoes in 1845 was 32,636
bushels or about 140 bushels per farm. This
total was greater by a considerable margin than the combined production
of barley, buckwheat, wheat, corn, and rye (which totaled less than 100
bushels per farm in all). Only
oats, at 180 bushels per farm, exceeded the output of potatoes.
Potatoes in the 1840s were affected in the United States by a blight, “introduced no doubt from Ireland,” which “swept like a wave of fire over the fields of North America.”[13] Delaware County potato output dropped by more than half between 1845 and 1855. By 1860, however, pre-blight output had almost been regained and production increased steadily on the whole until 1910. Subsequent censuses registered a sharp decline over the next half-century, from 95 bushels per average Delaware County farm in 1910 to only 6 bushels in 1954 and 3 in 1997.
Butter
and cheese. In the 1800s,
almost every farm in Delaware County, and even many small town households, had
at least one or two dairy cows. There
was only a small non-farm market, however, for fresh milk.
The surplus was made into farm butter and cheese or it was fed to the
hogs. Delaware County farm
cheese production declined steadily from the earliest year for which data
are available, 1845. In that year
production averaged almost 30 pounds per farm.
Some commercial cheese making did develop.
Davenport village had a small cheese factory in the late 1800s located
near the center of town on land now east of the Methodist Church.
Another cheese factory operated in Fergusonville.
Cheese enjoyed a brief resurgence before the 1920 census.
Because of the stimulus of WWI, Delaware County farm cheese had
increased 30-fold over its 1910 production, but only reached an average of 3.6
pounds per farm.
The
fortunes of farm butter rose with
improved transportation and fell with the coming of commercial creameries.
The average farm family in Delaware County produced 700 pounds in 1845
when output was first reported. (Davenport’s
production in 1845 averaged only a little under 600 pounds per farm.
The town’s cheese production in that year, however, exceeded the
county average.) As
transportation and access to distant markets improved, farm cheese production
fell and that of butter rose. Spurred
by the coming of the railroads, butter reached 1470 pounds per farm household
in 1880 and 1750 pounds in 1890, slightly less than five pounds for every day
of the year. The human (mainly
female) labor of churning all that butter was shortly thereafter replaced by
the steam-driven power of creameries. Farm
production fell by one-third between 1890 and 1900.
By 1910, farm butter had almost disappeared from the Delaware county
scene.
Flax
and wool. Flax (for
lint, seed, oil and feed) and sheep (for meat and wool) were among the early
staples of Delaware County farms. They,
however, succumbed even earlier than cereals, butter and cheese to outside
forces. Both flax and wool
production were probably near their peaks when output was first reported in
1845. Flax was soon displaced by
other crops for feed, oil and lint, especially by cheaper cotton from the
emerging Southern producers. Delaware
flax production almost ceased after 1845, though it picked up again briefly
during the cotton shortages of the Civil War.
Delaware
County sheep averaged close to 30
per farm in both 1835 and 1845. These
numbers reflected a boom brought about after 1820 by high prices for fine
wool. Before this, few flocks
existed “outside of Long Island and down the Hudson valley.”
“Of all livestock [sheep are] the most difficult to rear under
unfavorable environment, poor shelter, poor food, and the ravages of wolves
and other wild animals,” and this “almost prohibited the rearing of sheep
in frontier settlements…”[14]
When
prices fell again, Delaware sheep flocks declined (though the average quality
and yield of wool per fleece increased)—to an average of only nine animals
per farm before the Civil War. Wartime
cotton shortages, as in the case with flax, led to a temporary rise between
1860 and 1865. This was followed
by further declines as competition from the west, including western New York
State, increased. After 1910,
average sheep numbers barely reached one per farm in most years, and county
totals fell from 9,300 in 1910 to less than 900 in 1997.
Apples
and apple cider. As with milk
cows, almost every farm family possessed apple trees.
Among Davenport farms in 1865, almost three-fourths of the smaller
holdings grew apples while for those with 50 acres or more of improved land,
apples were found on all but four in one hundred farms.
Davenport’s largest apple grower in 1865 was Andrew Oliver of the
Fergusonville Academy who reported having 300 bearing trees.
The average orchard among the larger farmers had over sixty trees.
Apple production, too, rose and fell with the times. Delaware farms averaged 72 bushels in 1865, 46 in 1875, 27 in 1890, and 88 bushels in 1900. These ups and downs reflected weather variations and the yield per apple tree. After 1900, in company with many other crops, apple production fell steadily from an average of 69 bushels per farm in 1910 to less than one bushel in 1954.
Less
is known about the production of apple
cider. By some accounts,
apple cider, especially the hard variety, was in the early days the beverage
of choice throughout the region.[15]
A cider pitcher was reportedly found on most dining tables, and one
author states that “cider was simply the most important of all beverages
consumed by New Yorkers for two centuries.”
An authority is quoted as having calculated that “per capita
consumption of cider in New York State and New England in the 1840s was 1.14
barrels—that was for each man, woman, and child.
Some thirst! …The typical Long Island and upstate New York farmer was
growing apples sufficient to make twenty-five or more barrels of cider a year
which he either pressed on his own farm or more likely took to a local cider
mill.”[16]
In the mid-1800s the average Delaware farmer (not necessarily the “typical” apple-growing farmer) produced 55-75 bushels of apples each year (equivalent to 14-19 barrels of the fresh fruit and not half that amount of cider). It thus seems unlikely that production by the local cider-producing farmers could have approached the 25 barrels in the earlier quotation. Agricultural censuses reported Delaware and Davenport cider production for only a few years, and the quantities amount to only a barrel or so per farm family. More may have been produced in cider mills off the farm, although Delaware County in 1865 was credited with only one such mill. (West Davenport had a mill, located on the northwest side of the bridge over the Charlotte River.) Still, more cider, especially of the hard variety, may have been made but simply not reported to federal and state census takers.
The
rise and fall of hops. Hops
in Delaware County make up a story of erratic wealth, of the ups and downs of
beer, of spreading interest throughout the county, of disease and fungi, of
memorable harvest times, and above all, of high risk.
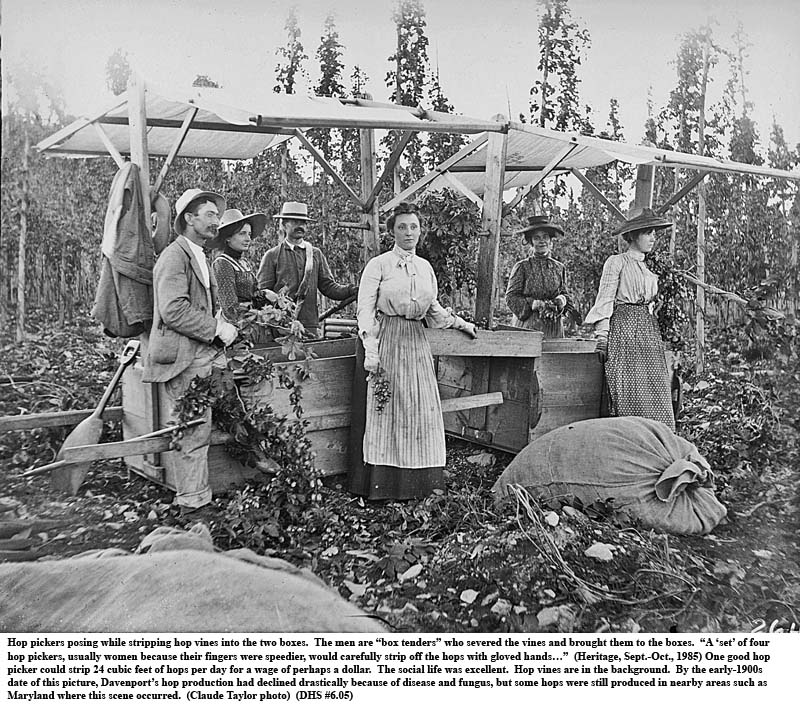
The
market for hops increased with the popularity of beer.
Around 1850 “domestic beer consumption began to increase dramatically
to meet the need of immigrants, especially those from Germany…”[17]
Hop growing shifted from New England westward, and much of the new
production was found in neighboring Otsego County, New York.
“In 1869 for instance, New York State produced ninety per cent of the
hops grown in this country and over a third of this harvest came from Otsego.[18]”
Hop-picking lasted in Otsego, according to Edwin R. Moore, from “near 1800
to well beyond the turn of the century. There
are many old timers [in the early 1960s] who look back with nostalgia to those
days in early September when friends and neighbors gathered in the hop yards
to earn a little pin money and enjoy a week or so of fun.”
[19]
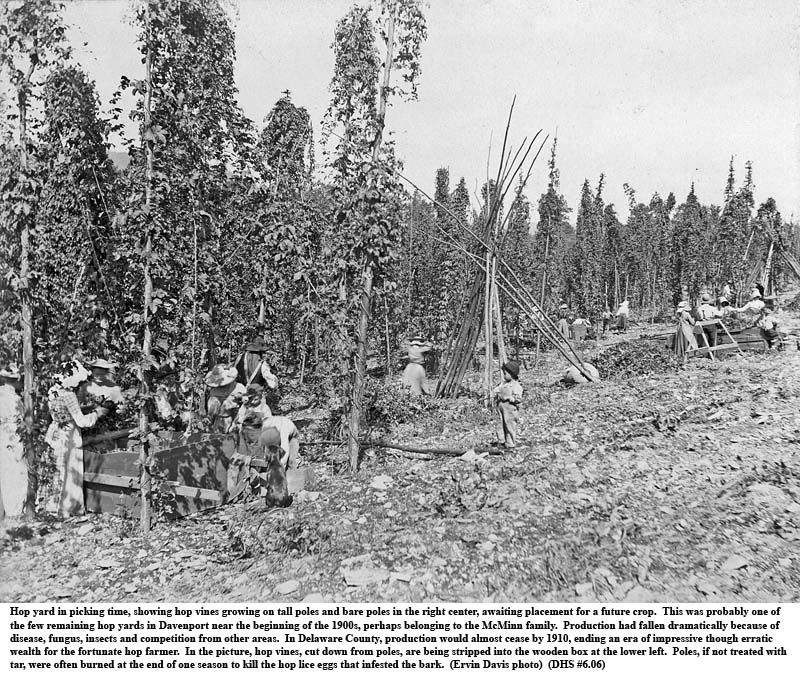
Though
never a major producer, Delaware County shared the wealth for a time as hop
production spread south and east along the Susquehanna River.
The town of Davenport led the way, producing 52,000 pounds in 1855,
three-fourths of the county total. (Franklin
and Sidney were the other two major producers, between them accounting for
almost one-fifth of the total.) By
the end of the Civil War, Davenport’s hop output rose one third more, but
the town’s contribution dropped to a little more than one-fourth of the
county total as farmers in other towns joined the hop-growing excitement.
Sidney and Franklin remained large producers but in 1865 were
out-produced by Kortright (57,022 pounds) and Harpersfield (37,937 pounds).
Even Stamford, with 20,206 pounds, reached the same level as Sidney.
By
1883, hop production costs had risen substantially, westward expansion
followed lower costs, and after 1900 a general decline began.
Delaware County’s hop production reached its peak about 1870 and then fell dramatically (by 75 percent) by the time of the 1875 state agricultural census. Hops regained two-thirds of their earlier peak in 1880 but subsequently declined even more dramatically until their disappearance after 1910. Production in all of the former major producing towns fell by large amounts between 1865 and 1875, with some producers (Delhi, Meredith, and Stamford) falling to zero. Davenport’s hop total dropped from 69,930 pounds in 1865 to 29,068 in 1875.
Even
within Davenport, still Delaware County’s major hop producing township in
1865, only certain farmers enjoyed the bonanza.
Few farmers with less that 25 acres of improved land grew hops and only
about one-third of larger farmers did. Roswell
Wheeler reported by far the largest hop fields: 10 acres in 1864 and 11 in
1865. But Wheeler’s 260
pounds-per-acre-yield in 1864, the production year of the 1865 census, was
among the ten lowest reported. Albert
Goodrich, with only a half acre in hops, claimed 1,400 pounds per acre.
The next highest was Matthew Sixsmith (later Sexsmith) with 2,562
pounds on a reported two acres. Eighteen
of the eighty growers planted three acres or more of hops; thirteen had 1864
yields of 800 pounds or more per acre.
Poultry.
A more recent boom-and-bust activity has been chicken raising.
Its full history is difficult to unravel because prior to 1920 the
census recorded only the value and not numbers of poultry.
Thus we know that two of three Davenport farms in 1865 raised poultry
but not the actual numbers of chicken, ducks, geese, etc.
(Most poultry in the earlier years were either consumed on the farm of
were traded for groceries—“women’s money.”)
Sometime
after World War I, chicken farmers began to discover economies of scale and
the benefits of large chicken houses. Later
came specialized hatcheries and the subsidized delivery of newly hatched
chicks by the U.S. Post Office Department.
The size of flocks began to increase, and the federal agricultural
census started to report the details. By
1930 there were 3,249 Delaware County chicken farms averaging 85 chickens of
more than three months age. By
1950 the number of chicken farmers had dropped by forty percent but average
flock size had almost doubled. The
number of chicken farms, in fact, decreased in every census after 1920.
There were 1474 Delaware farms in 1954, the year of peak chicken
production, 166 farms in 1969 when the average farm size reached its peak of
1226 chickens of 4 months and older per farm, and only 57 farms in the
agricultural census of 1997.[20]
Thus
the high point of Delaware County chicken production occurred somewhere
between 1954 (greatest production of chickens) and 1969 (largest average size
farm). By 1997, as with so many
other farm activities, Delaware County chicken production had almost ceased to
exist. The culprit once more was
competition from more favorably located parts of the country where even
greater economies could be achieved.
Where
did all the maple sugar go? A
funny thing happened to Delaware County’s maple sugar industry at the end of
the 19th century. Production
collapsed, plunging by almost four-fifths between 1890 and 1900.
The maple sugar business is always subject to the weather and is hence
erratic. But a sudden decrease
from 784,000 pounds to 170,000 pounds could hardly be blamed on the weather,
especially when production fell by a further sixty percent over the next two
decades. The question of
course is why.
The
first clue is that Delaware County was not alone.
Total New York State output fell by almost as much, namely by
two-thirds over the same 19th century decade.
The second clue is that during the 19th century one did not talk about
a maple syrup industry but a maple sugar industry.
Maple syrup, in fact, was at first not even called syrup but “maple
molasses.” Maple molasses arose
largely as a maple sugar byproduct and was darker and stronger-flavored than
today’s syrup. By the same
token, the maple sugar of the 1800s might not have been recognizable today.
Much was done to make it as white as possible, presumably to eliminate
the maple flavor.
Maple
sugar, in other words, was grown largely for use as a general-purpose
sweetener, and the quality standard was that of refined, white, cane sugar.
The Heritage article quoted
in the sidebar (“Whiter is Better”) tells the story of early, grandiose
plans by a group of Philadelphia investors to meet the sweetening needs of the
whole country from maple trees. The
plan was ultimately frustrated by successful cane sugar growth in Louisiana.
In
the end, maple sugar could not compete with cane and beet sugar though it does
seem to have held its own against another competitor, sugar from sorghum.
Refined cane sugar had been gradually overtaking maple sugar in the
decades prior to 1890. After
years of importing beet sugar from Europe, a U.S. beet industry began to take
off about 1890, and this provided maple sugar with a further challenge.
But it was not these factors alone which led to the precipitous
downfall of maple sugar.
It
was the fall in the price of white sugar against which the Delaware County and
other maple tree tappers simply could not compete.
The average price of granulated sugar dropped from 15 cents a pound
during the decade of the Civil War to 11 cents during 1870-79, to 7.8 cents
during 1880-89, and to 4.7 cents over 1890-99.
The final price decline, and undoubtedly the change that melted the
maple sugar market, occurred despite the large reduction in low-cost
imports from Cuba, Puerto Rico, and the Philippines accompanying the
Spanish-American War.
Nor
can maple sugar’s trouble be blamed on the rapidly growing imports of sugar
from Hawaii. These had risen
since an 1875 treaty had largely eliminated duties between the islands and the
United States. (The U.S. did not
acquire Hawaii until 1898.) But
Hawaiian sugar was relatively high-priced.
Its imported price was about 5 cents a pound at the end of the 1890s.
What
really drove down the price of sugar in the United States was the huge
increase in low cost (under 2.5 cents per pound) sugar from the Dutch East
Indies, primarily from the island of Java. This new source of sugar more than
offset lost imports from the former Spanish colonies, and its low price helped
force down refined and other sugar prices throughout the United States.
Thus an important cash crop
of Delaware and Davenport farmers was destroyed once more by outside
competition, but this time it was from plantations and scientists on the
opposite side of the world. In
fact, local hardship had come twice in a century from the same distant
country, today’s Indonesia. The
explosion of a volcano, Tamboro (sometimes also “Tambora.”),
had caused Delaware County’s “year of no summer” in 1816 (chapter 3),
and now an early “green revolution” on Java led to the dismantling of
Davenport’s maple sugar industry.
There was some compensation for the loss as farmers accelerated their shift from sugar to syrup production, a shift that had begun after the Civil War. This continued to maintain a minor but welcome infusion of cash during the late winter months when other farm activities were at a minimum. Delaware syrup production rose rapidly, more than doubling its 1890 level when it reached a peak of 99,000 gallons in 1920. Output, as with most local farm crops, declined thereafter with the general demise of farm life. From 374,000 trees tapped in 1920, the total fell slowly to only 64,000 (from 51 farms) by the time of the 1997 census.
Farming
at the millennium’s end. Farming
can be a precarious way to earn a living.
This is even truer when hillside soil is poor, when farms are too small
to encourage scale economies, when competition is strong from more favorably
situated areas, and when off-farm job opportunities easily outweigh the toil
and relentlessness of farm work.
Davenport
farmers have shown remarkable resiliency and determination over the years.
They have adapted in the short run to drought, pests, floods, political
vagaries, changing markets, and competition from as far away as Java on the
other side of the globe. Only a
few, however, have been able to accommodate to unending, longer-run economic
pressures.
These
few, in Davenport today, are dairy or other livestock farmers.
Three farms raise horses, including the show mount stables of Leo Lomangino (sidebar.) The dairymen
in particular have gradually evolved into heavily capitalized modern
businesses. The survivors have
been quick to adapt new (and especially labor-saving) technology, often
modified with creative ingenuity to fit local conditions, and modern business
methods. Even so, farm
income is usually supplemented by outside earnings of one or more family
members,[22]
and the critical factor in most cases has been subtle elements that have
continued to make farming attractive to younger generations.
Farms
have evolved into agro-businesses that require most of the same skills needed
for success everywhere in today’s economy.
The same applies to a number of additional, agriculturally-related
Davenport establishments, namely the several greenhouses and nurseries that
have been developed in recent years to serve both local and regional markets.
In early 2003, there were five such businesses in Davenport.
These ranged from a single, small greenhouse in Davenport’s east end—Nancy
and George Novellano’s Sweetmeadow Greenhouse—to many dozens of J.R.
Frazier and Sons greenhouses in the west end.
These latter totaled five acres (200,000-plus square feet) under
plastic or other protection.[23]
As
to the future, the well-watered and relatively fertile fields of the Charlotte
Valley floor should continue to provide some comparative advantage for a
limited number of local farmers. It
is not clear, however, to what extent local dairies can continue to count on
government intervention to stabilize or at least provide a floor under milk
prices.
A
larger problem for the next several decades, as will be touched upon later in
the Epilogue, may be the looming presence of global warming.
Warmer temperatures should extend growing seasons and provide some
benefits though they may also affect optimal crop and pasturage selection.
Of greater menace may be changes in rainfall and snow precipitation
patterns. If drying as well as
warming trends should persist[24],
the dairy farms (which require a surprisingly large amount of water for
livestock as well as for pasture and fodder) may be hard-pressed to continue
their generally successful adaptation to change.
The discussion above
mainly concerns Delaware County crops and livestock—and the medium and
longer run changes in some of these. Davenport
is mentioned but information is mostly limited to 1865 with some mention of
1855. The 1865 New York State
Census is no more detailed than for 1855 and 1875, but the Davenport
information for 1865 has recently been copied out by the Delaware County
Clerk, farmer by farmer, with a copy provided to the Davenport Historical
Center.[25]
Although a number of
Davenport’s young men were still away on army duty, the year 1865 is of
interest because many of the early farm products (sheep, swine, oxen, wheat,
rye, flax and cheese) were still important.
Peak production of other products (corn, oats, barley, buckwheat,
potatoes, butter, maple sugar, honey and apples) were soon to be achieved,
many of these new peaks occurring between 1875 and 1900.
The last quarter of the 19th century can legitimately be called the
golden age of Delaware County agriculture.
The number of farms and acres of farmland were at an all time maximum,
in turn leading to peak production of many crops.
Railroad transportation had improved market access, especially to New
York City, and more distant agricultural competition was but slowly emerging.
Davenport in 1865, on
the brink of this “golden age,” had reached close to its maximum number of
farms and improved acreage. Three
hundred and twenty-nine “farms” were reported as having some agricultural
production. Of these, however,
five seem to have had garden plots but no actual farmland as such.
One additional farm was shown with unimproved but no improved farmland.
Two of the remaining farm owners/managers/operators/agents can not be matched
with Davenport residents. Non-residents
presumably worked these two holdings.
The “average” of
these 329 “farms” contained 68 acres of improved and 37 acres of
unimproved farmland. Only ten
percent (7 acres) of improved land was plowed.
Field crops (including potatoes but excluding other garden crops such
as beans, peas, turnips, carrots, and onions) reportedly occupied 10.5 acres.
The “average farm” in 1865 grew largely hay and pasture (46 acres
of grassland and meadows), oats (4.6 acres), winter rye (1.5 acres), buckwheat
(1.4 acres), and Indian corn for grain and fodder (1.3 acres).
The farm had 1.7 horses, 5.4 milk cows (down from 6.4 the year
previous), and 0.2 working oxen.[26]
(See below for an idea of how
some of these averages varied in 1965 by farm size.)
Ninety-two farms grew
hops (up from 79 in 1864). The
1864 hop production came to a little over 1,000 pounds, on average, for each
producing farm. One Davenport
farm made two gallons of wine from grapes (sidebar), and 56 farms harvested
3,500 pounds of honey. Eighty-eight
farms manufactured flannel cloth, averaging about 20 yards each.
Fifty farm families made linen, a few more than reportedly grew flax,
and the average linen-weaving family produced 27 yards.
Fulled, cotton, and other cloth were produced in smaller amounts. (See
Chapter 5, footnote 4, for the process by which fulled cloth is made.)
But first note another
reason why some averages for any particular year may prove misleading.
This has to do with the short-run, year-to-year changes induced by
weather, prices, or other factors. Thus
from 1864 to 1865 many farmers reported significant increases or decreases in
the kinds and acres of the crops they grew and of the livestock they owned.
Even for the town as a whole, the sum total of these individual changes
could be significant. From 1864
to 1865, for example, possibly because of men returning from the Civil War,
Davenport’s total field crop acreage rose by 19 per cent.
Winter rye acres jumped by 73 percent, and increases totaling more than
10 per cent each were registered for barley, buckwheat, potatoes, and hops.
Wheat acres for the town, on the other hand, fell by 9 per cent.
The size distribution
of Davenport’s farms in 1865 was worthy of note.
Professionals, craftsmen and other non-farmers owned a majority of the
43 smaller farms of 10 acres and less of improved land.
(The land occupied by these small farms amounted to less than one per
cent of Davenport’s total.) Owners
included carpenters, laborers, millers, merchants, mechanics, shoemakers,
blacksmiths, innkeepers, a sawyer, a lawyer, and a physician.
These were obviously less-than-full-time farmers with significant
income from non-farm sources. Unusually
large numbers of these small farms did not possess either cows (12 of the 43)
or even apple trees (17 of 43). Their
products tended to be limited. Fifteen
of the forty-three produced no field crops at all.
The largest farms, on
the other hand, those with 100 to 500 acres of improved land, made up 39 per
cent of the total number but possessed a larger share—52 per cent—of all
improved land.
As the size of the
farms increased in 1865 Davenport, almost everything else increased too.
This included not only total agricultural output but also the number of
different crops grown and varieties of livestock carried.
Thus Indian corn was grown by one-third of farms with less than 25
acres (all acreage figures are for improved farmland), by 55 per cent of those
with 25-49 acres, by 61 per cent for 50-99 acres, and by two-thirds of those
farms with 100 acres and more. Almost
every other crop increased its representation as farms grew larger.
This generalization extended even to honey, maple sugar, apple cider,
and to the almost-but-not-quite universal growing of potatoes.
Farms, in other words and as illustrated in the table on the following
page, became progressively more diversified as their size increased.
DAVENPORT
FARM CHARACTERISTICS
1865,
BY FOUR FARM SIZES |
||||
|
Characteristic |
Small |
Medium- |
Medium- |
Large |
|
of farm |
|
Small |
Large |
|
|
Improved land: |
0-24
acres |
25-49 acre |
50-99 acre |
100+
acre |
|
|
||||
|
Number
farms |
63 |
68 |
99 |
93 |
|
Avg.
household size |
4.7 |
4.7 |
5.1 |
5.7 |
|
Avg.
farmland, acres |
|
|||
|
Total |
18.6 |
65.1 |
108.9 |
191.6 |
|
Improved acres |
7.5 |
37.3 |
69.3 |
132.9 |
|
11.1 |
27.8 |
39.6 |
58.7 |
|
|
Plowed land |
0.9 |
4.5 |
8.0 |
13.2 |
|
Meadows + grass |
5.2 |
25.0 |
45.9 |
91.3 |
|
Field crops |
1.8 |
6.3 |
12.0 |
18.4 |
|
|
||||
|
Proportion
all farms with: |
|
|
|
|
|
Farmer-owners |
41% |
82% |
97% |
98% |
|
Field crops grown |
71% |
96% |
100% |
100% |
|
Oats |
22% |
66% |
94% |
98% |
|
Winter rye |
10% |
35% |
59% |
55% |
|
Buckwheat |
8% |
47% |
68% |
74% |
|
Indian corn |
48% |
78% |
73% |
77% |
|
Potatoes |
60% |
82% |
96% |
97% |
|
Hops |
8% |
32% |
30% |
38% |
|
65% |
81% |
93% |
99% |
|
|
Maple sugar prod. |
21% |
49% |
74% |
76% |
|
Bees' honey |
5% |
10% |
13% |
35% |
|
Working oxen |
5% |
3% |
14% |
18% |
|
Horses |
33% |
87% |
8 |
98% |
|
Milk cows |
81% |
97% |
98% |
100% |
|
Swine killed, '64 |
48% |
82% |
86% |
99% |
|
Sheep shorn, '65 |
30% |
68% |
83% |
88% |
|
Poultry, '65 |
49% |
65% |
71% |
77% |
|
|
||||
|
Average
per farm, 1864 |
|
|
|
|
|
134 |
353 |
716 |
1175 |
|
|
Wool, pounds |
3.5 |
16.7 |
25.6 |
66.5 |
|
Wool/sheep, lbs. |
2.50 |
3.37 |
3.21 |
3.33 |
|
Apples, bushels |
12.0 |
38.3 |
58.6 |
120.6 |
|
Apple cider, barrels |
0 |
0.82 |
1.25 |
2.41 |
Even
the average number of persons in the farm household size grew larger with more
farmland. The census definition of “household” included servants,
aged parents, unmarried sisters or aunts, and farm laborers all living under
the same roof. A larger farm could support more people—and also
required more hands to work it.
Thus, while the great range in farm size precludes the notion of an “average” Davenport farm, there was nevertheless a certain predictability over the range of farm sizes. A number of small farms would add up to a single larger farm in almost every way, including the greater diversity of the crops produced, but of course not in terms of the total number of persons supported by the land.
A
picture of typical Davenport farms in 1865 is shown in the table on the
previous page for a range of farm sizes: small (below 25 acres of improved
farmland), medium-small (25-49 acres), medium-large (50-99 acres), and large
(100 acres to the largest farm, of 500 acres).
You may be a farmer if…
Your
dog rides in the truck more than your wife.
You
convince your wife that an overnight, out-of-state trip for equipment
parts is a vacation.
You
wear specific hats to farm sales, livestock auctions, customer
appreciation suppers and vacations.
You
have ever had to wash off in the backyard before your wife would let you
in the house.
You’ve
never throw away a 5-gallon bucket.
You
have used baling wire to attach a license plate.
You
have used a chain saw to remodel your house.
You
can remember the fertilizer rate, seed population, herbicide rate and
yields on a farm you rented 10 years ago, but can’t recall your wife’s
birthday.
You
have fibbed to a mechanic about how often you greased a piece of
equipment.
You
have used a velvetleaf plant as toilet paper.
You
have driven off the road while examining your neighbor’s crops.
You
have borrowed gravel from the county road to fix potholes in your
driveway.
You
have buried a dog and cried like a baby.
You
have used a tractor front-end loader as scaffolding for roof repairs.
You’ve
used your castrating knife to slice an apple.
(From
Ray Christensen, Special Assistant, New York State Department of Agriculture
& Markets, who reports that the list “just showed up on my desk one
day.”)
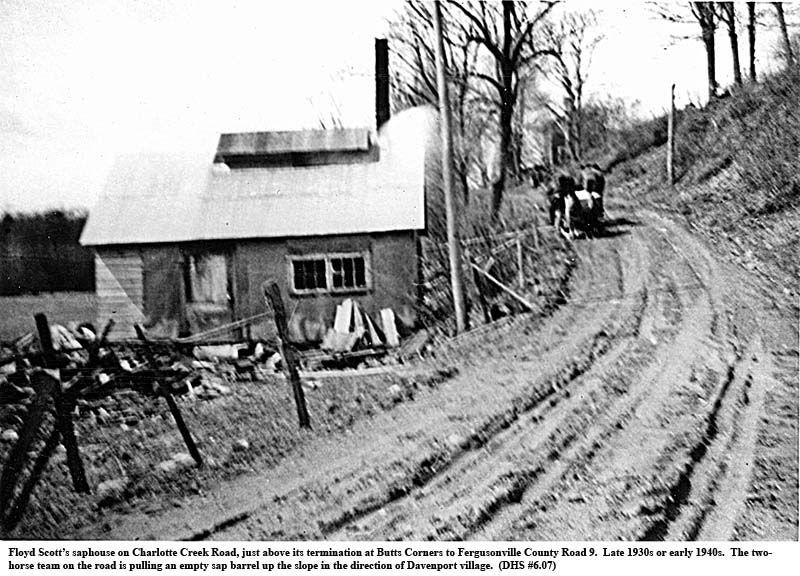
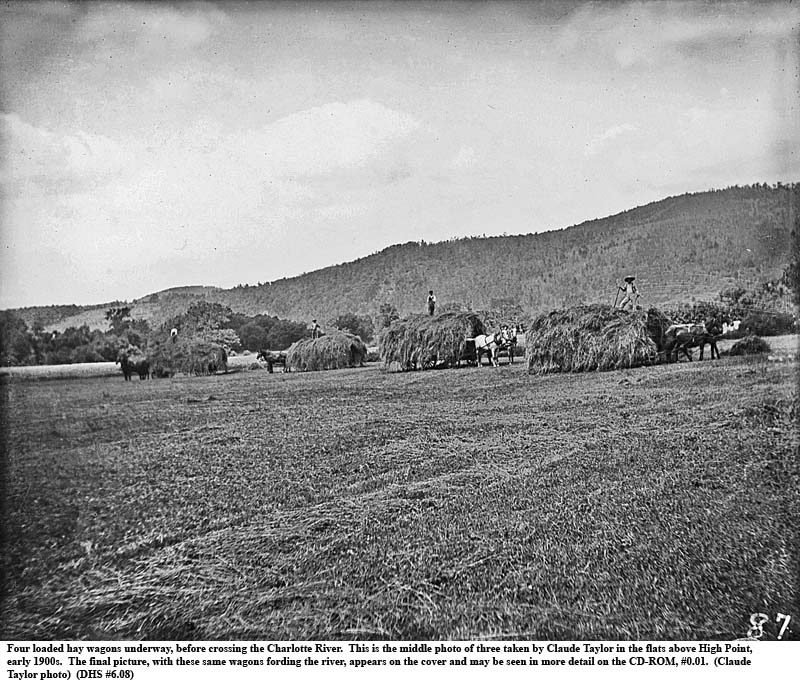
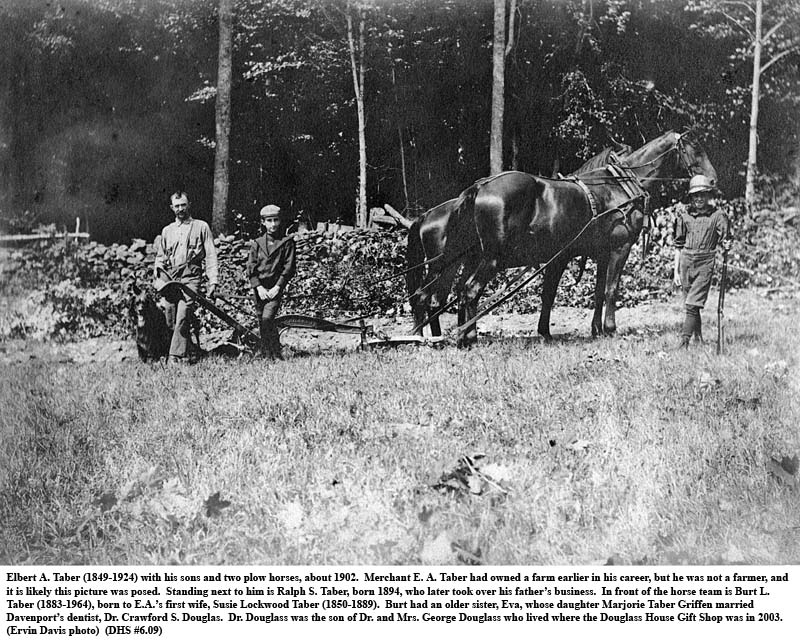
The following additional illustrations to be found here.

| 6a |
Haying time on the flats along the Charlotte River, 1920s |
| 6b |
Hay rake and horse, Davenport fairground in background, 1920s |
| 6c |
Two horses mowing hay, cleanup crew with scythe following |
| 6d |
Buckwheat field after harvesting and collecting into shocks, early 1900s |
| 6e |
Two horsepower threshing machine, early 1900s |
| 6f |
Loading hay on flats above High Point (prior to cover photo) |
| 6g |
James McNamara using a grain cradle |
| 6h |
Cutting corn in the last century, the Frank VanDuesen family |
[1]
Chapter 6 – The Changing Face of Agriculture
(This chapter is an adaptation of Alan M. Strout, “The Changing
Face of Agriculture in Delaware County and the Town of Davenport,”
corrections through March 2, 2002; Davenport Historical Society.)
[2] For comparability over the period 1800-1870, Davenport’s population includes those persons within the original 1817 town boundaries minus estimates of those lost to Otsego County somewhere between 1822 and 1837. (See Chapters 3 and 15 for more details.)
[3] 1875-1950 Davenport farm numbers are from M.C. Bond, “Delaware County, Census Data,” Dept. of Agricultural Economics, New York State College of Agriculture, Cornell University; Report A.E. 869, July 1953, mimeographed. The 2002 total includes 7 dairy, 6 beef or beef-plus-others, and 1 horse farm. The several greenhouse businesses are not included in the total.
[4]
Douglas DeNatale… from the household garden and sheep on the hillsides. (DeNatale,
1987, 3.)
[5]Nicholas
Sigsbee (1816-1889) reminisced… tea substitutes for most folks since real
tea was found only in wealthy households and then on Sunday only. (Sigsbee,
1889b, “In the Good Old Days.”)
[6]
These trends were followed by… emergence of dairying after 1830.
(The date is from Nicholas Sigsbee, 1889b).
[7]
Data to illustrate these medium-to-longer-term changes can be found in
federal agricultural censuses for Delaware County (1850-1997) and in the
decennial state censuses (1835-1875) containing varying details for the
towns themselves. Davenport in
the 1835-1875 period seems to have been a fairly average Delaware township.
Davenport’s population ranged between 5.2% and 5.8% of the county.
The town’s proportion of the county’s improved acreage, numbers of
livestock, and crop production have generally fallen in the 5-6% range with
outliers between 4 and 7% of the county totals.
Exceptions in the 1845-1875 years were the use of oxen and the making
of farm butter and cheese where Davenport tended to fall below county
averages. In contrast,
Davenport consistently produced more than its share of the county’s output
of rye, potatoes, peas and beans, and above all in later years, hops.
[8] Wheat was the grain of choice … “… there was a revival in central and eastern New York.” (Hedrick, 1933, 331-2).
[9] Most production figures shown in this paper pertain to the full year immediately before that of the census. They are shown for simplicity as pertaining to the date of the census itself, and should always be read as production “in the year covered by that census.”
[10] Hedrick observes… ”… always a fair yield on poor land in the hands of careless farmers.” (Hedrick, 1933, 338.)
[11]
At the time of the 1855 census, not a good year for cereals, Davenport’s
average yields had risen for corn to 32.6 bushels per acre.
For each of the other crops, yields had fallen.
For oats, the fall was by almost a half to 12.6 bushels per acre and
for the others by 30-40 percent (barley, 10.0 bushels; buckwheat, 8.9
bushels; and wheat, 7.1 bushels/acre).
These highly variable yields illustrate the shorter-run changes with
which local farmers have always had to contend.
[12] Average grain silage and hay have about the “same feeding value when determined on the basis of dry matter,” according to Robert R. Musgrave of Cornell University. See “Silage” in Encyclopedia Americana, vol. 24, p. 21, International Edition (Danbury, CT: Grolier, 2001).
[13]
Potatoes in the 1840s… “swept like a wave of fire over the fields of
North America.” (Hedrick,
1933, 342.)
[14] Before this, few flocks… this “almost prohibited the rearing of sheep in frontier settlements…” (Hedrick, 1933, 372.)
[15]
Frank Briggs made lots of cider although he did not drink the hard variety.
He lived up a steep road at the top of Pumpkin Hollow.
The cider, by then well-fermented, was kept for the snowplow crew,
and Frank’s road was always one of the first to be plowed.
[16] By some accounts, apple cider…”…either pressed on his own farm or more likely took to a local cider mill.” (“Cider: Folk Beverage Supreme,” in Heritage magazine, vol. 5, no. 2, Nov./Dec. 1988).
[17] The market for hops increased with… the need of immigrants, especially those from Germany…” (“Hops, the “Pernicious Weed,” Heritage, vol. 2, no. 1, Sept/Oct. 1985.)
[18] By 1874, however, Otsego’s production had been surpassed by Madison and Oneida counties, and Otsego’s contribution had fallen to one-seventh of the New York State total.
[19] “In 1869 for instance, New York State produced… a little pin money and enjoy a week or so of fun.” (Moore, 1964, 2.)
[20] An attempt was made in the 1950s to increase local poultry consumption by popularizing barbecue chicken. Among other tasks of the Delaware County Poultry Commission (whose nine members included the author, at that time a substantial poultry-grower) was the sponsorship of an “annual broiler barbecue” in Delhi. (Oneonta Star, July 28, 1953; and The Daily Star of Oneonta, July 28, 2003, p. 6, under “50 Years Ago.”)
[21]
Java’s production took off… to 1,162.2 million pounds.
(For sugar import figures, see U.S. Bureau of Statistics, 1901, p.
332.)
[22] Steady outside income can be especially important when approaching a local bank for the always-important crop and equipment loans.
[23] The number of establishments growing nursery or greenhouse crops in Delaware County increased from 25 in 1992 to 61 in 1997. Area under glass or other protection (today, largely plastic) grew by 14 percent, and cropland in the open grew almost nine-fold, to 289 acres. Most of the Delaware greenhouses grew floriculture crops—bedding/garden plants and foliage, potted flowering plants, etc. (U.S. censuses of agriculture, New York State and county data.)
[24] Drying in many areas is expected to accompany warming, even when rainfall remains constant, because of increased evaporation.
[25] Published totals for Davenport cannot in all cases be reconstructed accurately by adding up the farm-by-farm numbers. This is because of errors in addition in 1865 and because of later errors in copying the 1865 results, the latter worsened in some cases by severe deterioration of the original census pages. In general where totals are quoted they are from the published results while the reconstructed estimates have been used for individual farmers, groups of farmers, and some averages.
[26]
The average
farm saw the butchering of 0.6 cattle for beef, and 1.8 hogs (yielding 415
pounds of pork). It produced
649 pounds of butter, but reported no cheese that year.
Thirty-one pounds of wool came from 9.4 shorn sheep.
In the entire town, only 54 sheep were butchered in 1865 (an average
of 0.16 per farm) while another 11 were killed by dogs.
The farm produced 62 bushels of apples from 43 trees and 123 pounds
of maple sugar.